
Here is why you should buy Aditya Birla Fashion, Max Financial, & sell Asian Paints in short term

Hot Stocks | Nifty50 on March 2 witnessed a gap down opening tracking global peers and continued to trade in a negative terrain without disturbing its previous day’s low. Prices closed 1% lower, but within the previous day’s range, forming an inside day pattern on the daily scale.

On the daily chart, prices broke through the horizontal trend line support at 16,800, confirming a consolidation break. Prices have likely finished a pullback near the trend line resistance at 16,700 – 16,800 levels.

SOURCE : IPOINFO

India’s bourses have also closed above the PRZ and produced a bullish ABCD Harmonic Pattern (potential reversal zone). Buying every downturn by DIIs suggests support from Indian institutions at lower levels, according to FII & DII findings this week.

Currently, the Nifty has support at 16,400 & 16,200, & a breach below these levels will lead to 15,800 in next weeks. The upper band is cap near 17,100 & once the gap gets fill then the range might extend till 17,400 levels.

Here are two buy calls and one sell recommendation for next 2-3 weeks:

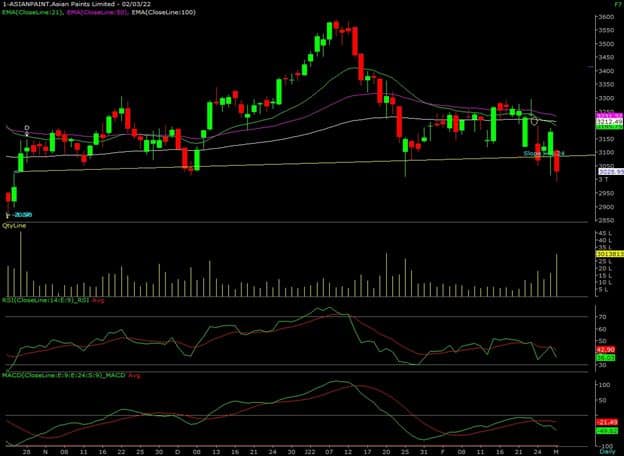
Asian Paints: Sell | LTP: Rs 3,029 | Stop-Loss: Rs 3,100 | Target: Rs 2,909 | Return: 4 percent

Hot Stocks | Asian Paints has developed a neckline support at Rs 3,100 levels in the recent four months. On March 2, prices broke a Head & Shoulder pattern’s neckline and gave a negative breakdown in the counter.

Prices are sustaining below all its important exponential moving averages on the daily interval. The previous three times, prices bounced back from the neckline support at ₹3,100, but on March 2, prices forcedly closed below the support.

Majority of the indicators and oscillators are indicating a negative range shift in the prices. Counter has also witnessed an above average volume during breakdown indicates a price volume breakdown.

Image1232022

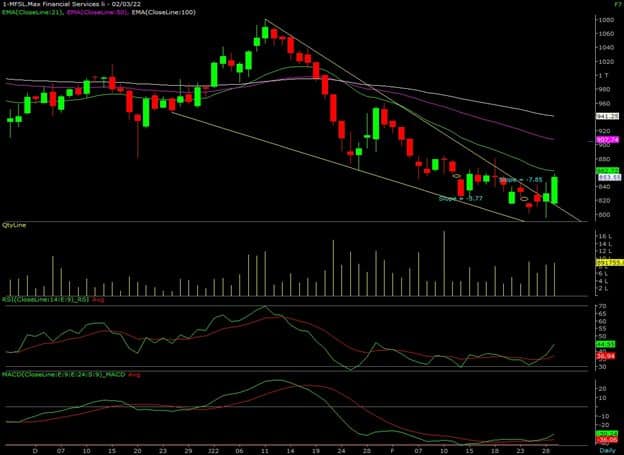
Max Financial Services: Buy | LTP: Rs. 853.5 | Stop-Loss: Rs 815 | Target: Rs 918 | Return: 7.5 percent

Since the second week of January, prices have been trading in a lower low lower high pattern, with a daily falling wedge pattern.

Max Financial developed a bullish Engulfing candlestick pattern on the weekly scale after a falling trend line breakout on the upper side.

The RSI (14) has established a bullish divergence and has recovered from oversold levels, indicating a significant price recovery.

Image2232022

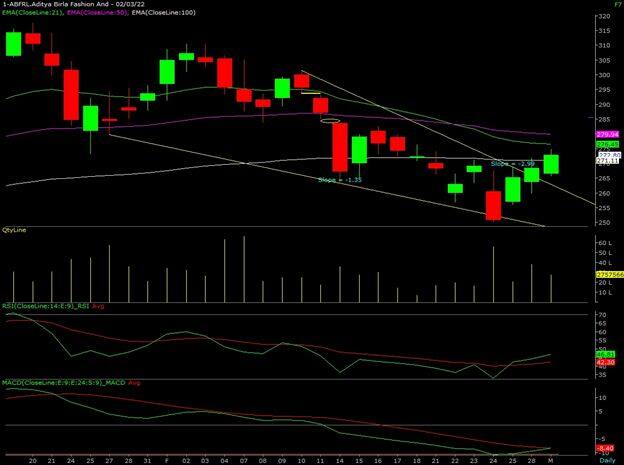
Aditya Birla Fashion & Retail: Buy | LTP: Rs 272.80 | Stop-Loss: Rs 260 | Target: Rs 295 | Return: 8 percent

ABFRL has created a bullish three white soldier candlestick pattern on the daily interval. Prices broke out of a falling wedge formation and closed above the previous day’s high.

On a weekly basis, prices have form a bullish Engulfing candlestick pattern, which will be confirm if prices close above the candle’s high. The counter is firmly finding the support near its 50-week exponential moving average.

Oscillators are still below 50 but have managed to reconnect, indicating a gain in momentum in the coming trading session.

Image3232022

Disclaimer:. The views and investment tips expressed by investment experts on ipoinfo.co.in. are their own and not those of the website or its management. ipoinfo.co.in advises users to check with certified experts before taking any investment decisions.

Popular posts from this blog

Today’s Cryptocurrency Prices: Bitcoin and Ethereum maintain the markets in the green, while Avalanche declines.

SOURCE: IPO INFO The worldwide crypto market capitalization increased 4.75 percent to $2.39 trillion in the last 24 hours, while trading volume increased 14.11 percent to $102.84 billion.  Stablecoins ($79.65 billion) accounted for 77.45 percent of the trading volume, while DeFi ($17.44 billion) contributed 16.96 percent. Bitcoin, which is presently selling at $51,103.04, has increased its market share to 40.50 percent. In terms of key cryptocurrencies, Bitcoin gained by 4.21 percent to Rs 39,64,949, while Ethereum increased by 1.95 percent to Rs 3,18,710.1. Cardano (Rs 114.01) increased by 8.41%. Over the last 24 hours, Avalanche (Rs 9,379.73) fell 2.76 percent, Polkadot (Rs 2,250) climbed 3.12 percent, and Litecoin (Rs 12,840.66) rose 4.39 percent. Tether fell 1.32 percent to Rs 77.86 per unit. SHIB , a meme coin, climbed by 10.25 percent, while DOGE increased by 3.94 percent to Rs 14.24. Bitcoin is currently trading at Rs 38,33,811, whereas LUNA is currently trading at Rs 7,669.99,

Data Patterns IPO opens today. Should you subscribe to the issue?

Please visit our website IPO Info  for more information.   The  Data Patterns (India) Limited  IPO will hit the primary market on December 14 and will be open to subscription for the next two days. Data Patters India (IPO) is among the few vertically integrated players providing solutions related to defence and aerospace electronics. Incorporated in 1985, it offers products to the entire spectrum of defence and aerospace platforms – space, air, land, and sea, and is well positioned to benefit from the government of India’s ‘Make in India’ push. The company has established itself as a leading solutions provider to the indigenously developed defence products industry through its in-house design capabilities across the spectrum of strategic defence and aerospace electronics solutions, including processors, power, radio frequencies and microwave, embedded software, and firmware, and mechanical engineering. Its products have been used in flagship defence projects like Tejas Light Combat Air

MF investors load up on equity mutual funds in March, dump bond funds

Equity mutual funds have closed the financial year 2022-2023 on a mixed note. Equity schemes of Indian mutual funds saw net inflows of Rs 28,463 crore in March 2022 compared to net inflows of Rs 19,705 crore in the previous month. The overall assets under management remained almost flat at Rs 37.56 lakh crore as on March 31, 2022, due to outflows from bond funds. Systematic investment plan (SIP) has been a preferred means for investing in mutual funds especially in equity funds for most individual investors. SIP contribution for the month of March 2022 was recorded at Rs 12,327 crore compared to Rs 11,438 crore in the previous month. The number of SIP accounts has gone up to 5.27 crore in March 2022 compared to 5.17 crore in February 2022. Index funds have seen net inflows of Rs 12,313 crore in March 2022 compared to net inflows of Rs 5,747 crore in the previous month. All open-ended equity scheme categories have seen net inflows in March 2022. A large chunk of money however came throu